Your programmatic ads are performing well – or are they?
The only way to really know is to look at your analytics, and the key ad metrics that help you make better strategic campaign decisions.
There may be a lot of metrics to measure, but some are more valuable than others. Too often advertisers focus on the wrong metrics that lead them astray!
That’s why today’s post is about 7 extremely important and relevant metrics that will help you make clearer, stronger and better decisions for your next big programmatic campaign.
Here is the list of ad metrics we will cover today:
At the end of our blog, we also have a TL;DR version summary if you’re short on time!
Impressions
Impressions are an important baseline metric, because they help you understand how many times your ad media was displayed in your inventory.
They answer the question:
Impressions are not about who has seen your ad. Instead, they‘re about the potential that your ad has to be seen. So you can’t really assign a reliable, quantitative weight to these metrics.
This metric isn’t based on an action, but instead acts as a valuable part of calculating other critical metrics that will lead to better campaign performance.
The two types of ad impression are:
#1: Served – when served content is transmitted it counts as an impression
#2: Viewable – when more data is used to understand if a user saw the ad content or not
Served impressions are unreliable, while viewable impressions are more accurate. The most vital of the two are viewable impressions because they provide data analysts with actionable performance data for campaign improvement.
Clicks
Clicks are a performance metric.
They answer the question:
With programmatic ads, clicks are among the most telling metrics you can measure. It’s not accurate to assume all clicks are intentional, and they certainly don’t all lead to a conversion.
But when you combine click and impression metrics, you can calculate actionable percentages that help you make better campaign budget decisions and improve your ad ROI.
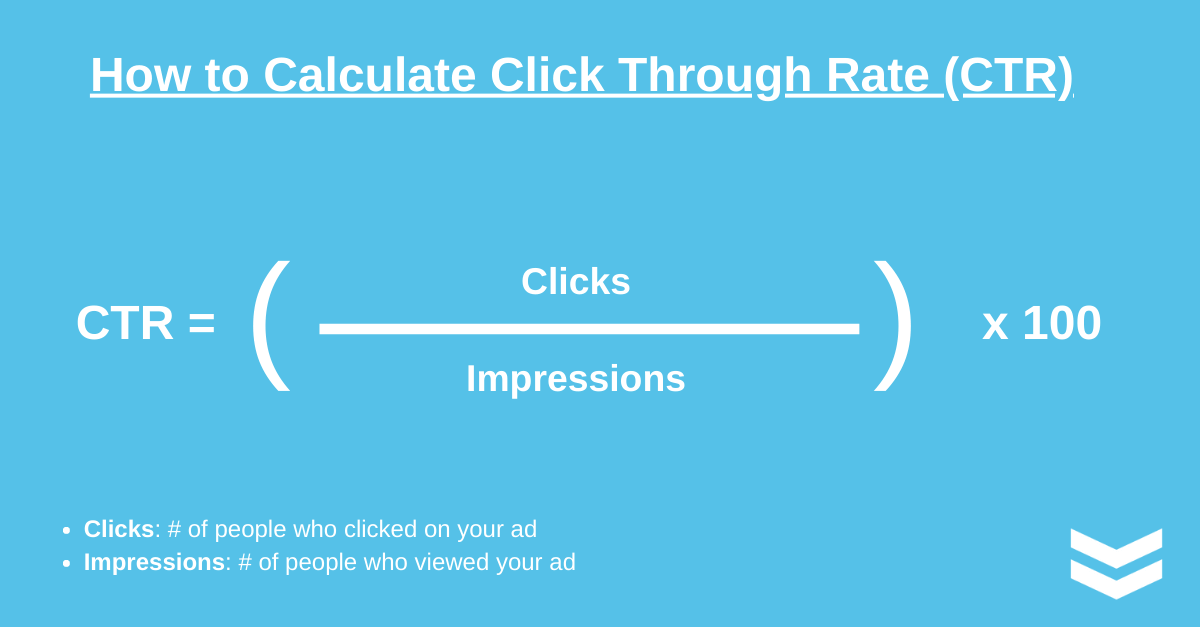
In Display Advertising, calculating your Click-Through Rate means determining the percentage of people who saw and clicked on your ad.
Here is how you can calculate Click-Through Rate:

If 3 people saw your ad every 100 impressions, you have a 3% CTR for example.
Clicks help you understand ad success when combined with other metric data!
Conversions
Conversions are a performance metric.
They answer the question:
Every ad campaign has goals, or actions that advertisers want the consumer to complete because of the ad that has targeted them. Conversions are the ultimate ad metric.
You get all sorts of conversions – buy, sign-up, download, comment – these are all measurable actions. The achievement of conversions means the customer is either buying, or has a much higher chance of buying, from your brand in the future.
Cost
Cost is a financial metric.
It answers the question:
Programmatic ads cost money to run, and the point is to set a budget that secures you the right inventory and target audience. That means measuring cost in relation to many other ad metrics.
As you delve into the world of digital advertising, it’s essential to incorporate financial planning and budget tracking tools into your strategy, ensuring that every advertising dollar is spent wisely and aligns with your business’s financial goals.
You can measure cost-per-mille, cost-per-click, cost-per-engagement, cost-per-view, cost-per-conversion and a host of other financial metrics you’ll need to understand campaign success.
Cost metrics directly influence how you will invest in your next ad campaign. Sometimes you’ll want to target better quality inventory, because your budget parameters didn’t allow you the right inventory in your previous campaign. Your goal is to keep testing to find the right cost levels.
These will help you determine your overall Return On Investment.
As you delve into the world of digital advertising, it’s essential to incorporate financial planning for SMBs into your strategy, ensuring that every advertising dollar is spent wisely and aligns with your business’s financial goals.
Revenue
Revenue is a financial metric.
It answers the question:
With this ad metric, you need to know everything from gross revenue to net revenue. Coupled with your cost metrics you can calculate and refine media, data, agency, tech and other fees – and even streamline your profit margins over time.
The most important of these are the overall revenue generated from your campaign, revenue created per visit and revenue created per page (RPM).
Reach
Reach is a brand metric.
It answers the question:
Reach is a critical ad metric for understanding how many people your campaign actually reached. Unlike impressions, reach is calculated per person, not per potential view.
Reach can be compared with other vital metrics, like CTR, frequency and impressions to better understand ad success. Paid reach often increases viral and organic reach of your unpaid content.
Estimating reach can also help control the parameters of a new ad campaign.
Return On Ad Spend (ROAS)
ROAS is a performance metric.
It answers the question:
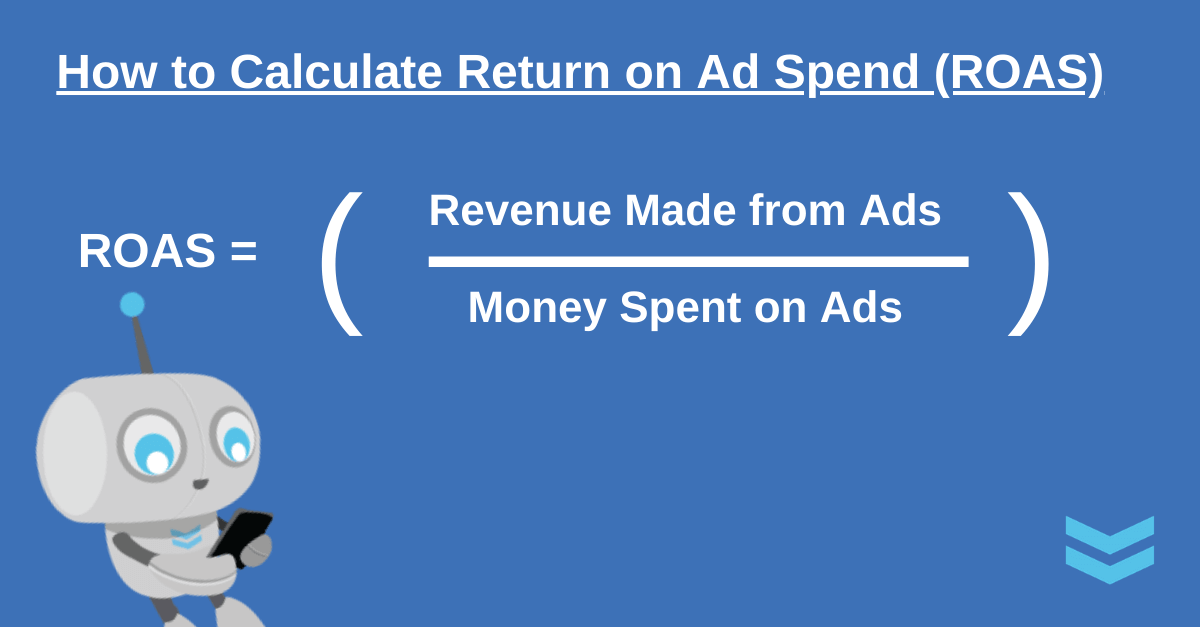
ROAS, or Return On Ad Spend is a campaign-specific metric that is often used in the same way Return On Investment (ROI) (return-on-investment) is used. Only ROAS measures gross revenue from ad spend and speaks to the current effectiveness of your campaign.
ROI tends to focus more on the bigger picture.
Read in-depth on the difference between ROI and ROAS on our other blog article, “Return On Ad Spend (ROAS): Explained”.

A good ROAS ratio is based on your niche, investment and target audience.
Conclusion
Programmatic ad placement and benchmarking is part of the campaign process.
You’ll have to run several campaigns before you are fully orientated on best practices for your niche and audience.
Programmatic ads perform better over time when you carefully analyze the right metrics.
Avoid vanity metrics and focus on creating actionable insights from the numerical data you get from your campaign calculations.
What Have We Learned?
- Impressions are used to measure how many your ads have been displayed.
- Clicks show how many times your ad had been clicked on.
- Conversions are a performance metric that tracks how many consumers completed an action (signing up, downloading, booking, making a purchase).
- Cost encompasses budget and can directly impact campaign performance.
- Revenue is a financial metric that evaluates how much revenue your ad generated. By combining this with the ‘Cost’ metric, you can calculate different categories of fees (media, tech etc) and optimize your profit margins in the long run.
- Ad Reach shows how many unique users your ad campaigns reached.
- Return On Ad Spend measures gross revenue and measures the effectiveness of your ad.


