The Internet is the most important and lucrative source of advertising today. Statista states global digital advertising expenses will increase to $835 billion by 2026. Yet, due to the issue’s complexity, the number of media utilized for advertising, and the immense competition, ensuring the efficiency of digital ads campaigns became a complicated task.
Below, we’ve gathered seven valuable tips on analyzing and optimizing your digital ad campaigns so that you can ensure continuous improvement and commercial success.
Choose the Right Metrics to Track
You’ve got to keep your eyes on the right metrics to know if your ads are doing their job. In this section, you’ll find the descriptions of metrics that can provide insights into your campaign’s efficiency, enabling you to pinpoint areas of improvement.
Cost per Acquisition (CPA)
This metric estimates the cost of acquiring a customer through an online ad campaign. It’s a solid way to see if your ad attracts people and excites them. All you do is take your total ad spend and divide it by the number of conversions. CPA can help determine how much you can or want to spend to get each new customer.
Click-Through Rate (CTR)
This metric checks how often people who see your ads actually click on them. It’s useful for understanding how well your ad is placed, if your Call-To-Action (CTA) is doing its thing, and if your offer is grabbing people. Plus, keeping tabs on your Click-Through Rate can give you a clue about what ads people dig. You calculate it by dividing the total clicks by the total impressions.
Conversion Rate
The conversion rate measures how many people have completed a particular action after seeing your ad. You should determine the desired action by yourself. Among the popular options are joining an email list, making a purchase, etc. The higher your conversion rate, the better your leads and profits. The formula varies depending on what action you’re interested in, but here are a few you can use:
Conversion Rate = (Number of Conversions / Number of Sessions) * 100
Conversion Rate = (Number of Conversions / Number of Unique Visitors) *100
Conversion Rate = (Number of Conversions / Number of Leads Generated) *100
Mind that the result depends not only on the ad, its appearance, CTA, etc., but also on the quality and appeal of the landing page. So make sure the navigation is easy, the page looks good, and has a nice UX/UI design, like a convenient checkout for an eCommerce website search.
Social Engagement Metrics
Engagement metrics like shares, likes, and comments provide additional insight into how your audience interacts with your ads. They’re essential for social media campaigns, where engagement can greatly influence reach and visibility.
Return on Investment (ROI)
A high ROI means your ad is making more than it costs, so it’s a great way to figure out what type of ads get people to spend their money. To get your ROI, take the current value of your investment, subtract the cost, then divide it by the investment cost.
Cost per Click (CPC)
Cost per click (CPC) measures each click’s cost on an ad. It can assist you in determining how much money you are willing to pay for each visitor to your website or landing page. To calculate it, divide your total ad cost by the number of ad clicks.
Run A/B Tests Even with Successful Campaigns
The digital landscape is changing rapidly, and consumer preferences along with it. Running A/B tests regularly allows you to understand what’s working, what’s not, and what can be improved, ensuring your campaign remains relevant and engaging.
A/B testing is a well-known performance assessment tool. Yet, what needs to be more widely covered is that even when performance is good, it might help you identify ad or landing page modifications that will work better than current ones.
When doing an A/B test, change one element at a time to monitor how changes affect performance. Run two versions of the same advertisement with just one modification at a time. The modification may be to the content, the visuals, the call to action button, the colors, etc.
Use Heat Maps for Visual Insights
Even when things seem to be going awesome with your campaigns, you’ve got to remember that everything online changes super fast – and so do people’s tastes. That’s why it’s a great idea to keep doing A/B tests to figure out what’s working, what’s not, and what you could tweak to improve it.
Sure, you’ve heard about A/B testing to check your ad’s performance, but here’s the kicker: it can also help you find better ways to run your ads or landing pages, even when they’re already doing well.
When running an A/B test, just change one thing at a time, then see how that affects your results. It’s like running a race with two nearly identical cars, but you’ve tweaked the engine in one of them. You might change up your content, the pictures, the ‘click me’ button, the colors – anything!
Heat maps provide a visual representation of data on users’ activities associated with an ad by converting facts and statistics into simple, color-coded images. Digital marketers may make better choices regarding ad content and placement thanks to this type of data presentation.
There are a few different types of heat maps you could use:
Click Heat Maps
These show where people click the most on your site or ad. It’s like a spotlight on what’s catching people’s eyes and getting them to take action.
Scroll Heat Maps
These maps track how far people scroll down your page. Super useful if you’re figuring out where to put your ads. For instance, if people hardly ever scroll halfway down, there’s no point in putting your ad at the bottom.
Move Heat Maps
These maps follow the cursor around the page. It’s like a trail showing which parts of your ad or site draw people in.
Eye-Tracking Heat Maps
These heat maps show where people’s eyes linger on a page. It’s like being able to read their minds, knowing what parts of your design and ad placement are grabbing their attention.
Optimize Your Ad Placements
Ad placement is the location of your advertisement on a website, a social media feed, or any other platform where you choose to promote. This can be anywhere on a page: the header, sidebars, the text, the space between sections, etc.
Placement has a significant impact on how consumers respond to your adverts. For instance, advertisements above the fold (visible without scrolling) typically receive higher visibility. Similarly, a social media user’s newsfeed ad may get more attention than one on the sidebar. Here are some suggestions on how to arrange your advertisement best.
There are recommended practices for ad placement specific to each advertising platform.
- Learning about and comprehending these procedures to get the most out of the platform
-
With the use of heatmaps, determine where your audience spends the majority of their time on the page
-
Experiment with different placements and assess their performance to determine the most effective locations for your ads
-
Make sure that your advertisements are appropriately displayed across various screen sizes
-
Ads should be visible, but they shouldn’t hinder user experience
Define the Right Timing
Even the best ad ever might not deliver the best results if it’s presented at the wrong time! When choosing the optimal time to display your adverts, consider your audience’s behavior and time zones, working hours, and peak internet usage periods.
You may examine each hour of the day and the most beneficial days of the week. It would also be nice to analyze your competitors’ posting times.
Advertising at off-peak hours might occasionally be a winning strategy for your campaign optimization since there is less competition. Although you could receive fewer impressions, you’ll get more clicks at less expense.
Mind that if you try to advertise during a particularly busy period, like the holidays, you’ll face increased CPC due to more competition.
Do Multivariate Testing
While A/B testing focuses on changing one variable at a time to determine which version performs better, multivariate testing takes this concept further by testing multiple variables simultaneously.
Multivariate testing involves changing more than one component of an ad at once to examine the combined effect of these changes on the ad’s performance. This could include altering multiple elements like the headline, image, call-to-action (CTA), ad placement, etc., simultaneously and seeing how these combined changes impact the results.
The main objective of multivariate testing is to determine which combination of variations shows the best results. This testing approach provides a more complex understanding of how the different elements of your ad interact and contribute to its overall effectiveness.
Multivariate testing has several advantages over simpler A/B testing:
- Deeper Insights: Multivariate testing can uncover interactions between different elements of your ad that you might not discover with A/B testing. For instance, a specific headline works best with a particular image but not as well with others.
- Efficiency: By testing multiple changes simultaneously, you can optimize different aspects of your ad in a shorter time frame compared to A/B testing each change individually.
- Data-driven Decisions: Multivariate testing gives you data-backed insights into the best combination of variables, reducing guesswork and facilitating more informed decisions.
However, remember that multivariate testing demands a large amount of traffic to deliver statistically significant results due to the multiple combinations being tested. It’s best utilized when you have a considerable amount of traffic and when the stakes are high for campaign performance.
Utilize Ad Testing and Optimization Tools
Be bold and turn to valuable tools. They will do the job more quickly and provide information unavailable through other resources. Here are some of the best ad testing and optimization tools:
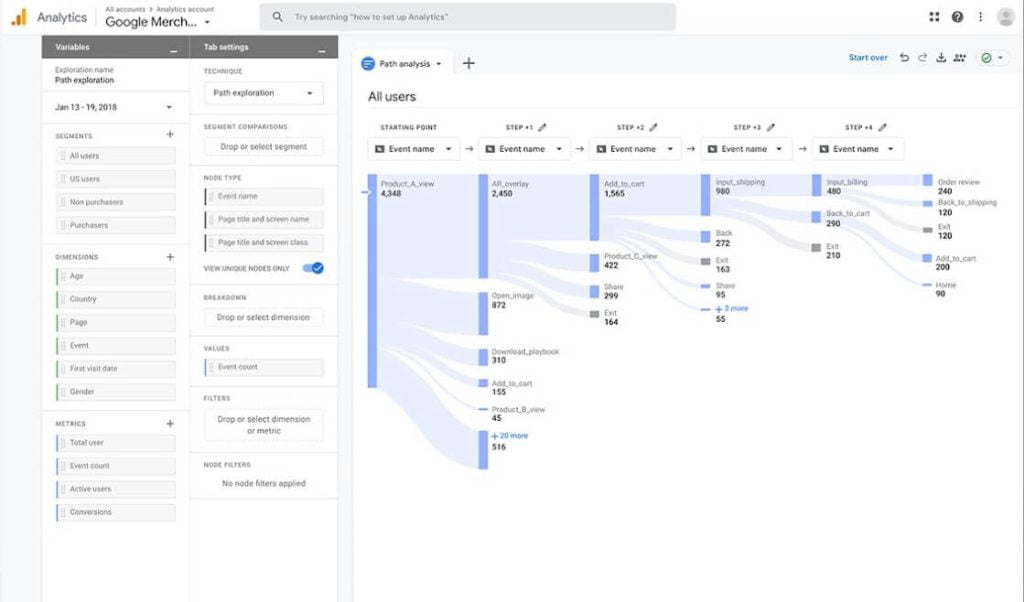
Google Analytics 4
Google Analytics is a free and essential website analytics tool. You may use it to monitor website traffic, find out where visitors are coming from, how they found your website, how long they stayed there, and other information. The platform may also be coupled with additional tools like Google Ads and Google Data Studio for a more thorough study of your marketing data.
Learn more about GA4 here.
Meta Business Manager
Meta Business Manager is a platform that makes managing Facebook and Instagram accounts and ads easier in a centralized account. It offers a central place for tracking adverts. It can also create lookalike audiences from your data to elevate your campaigns and offer even better audience targeting.

Optimizely
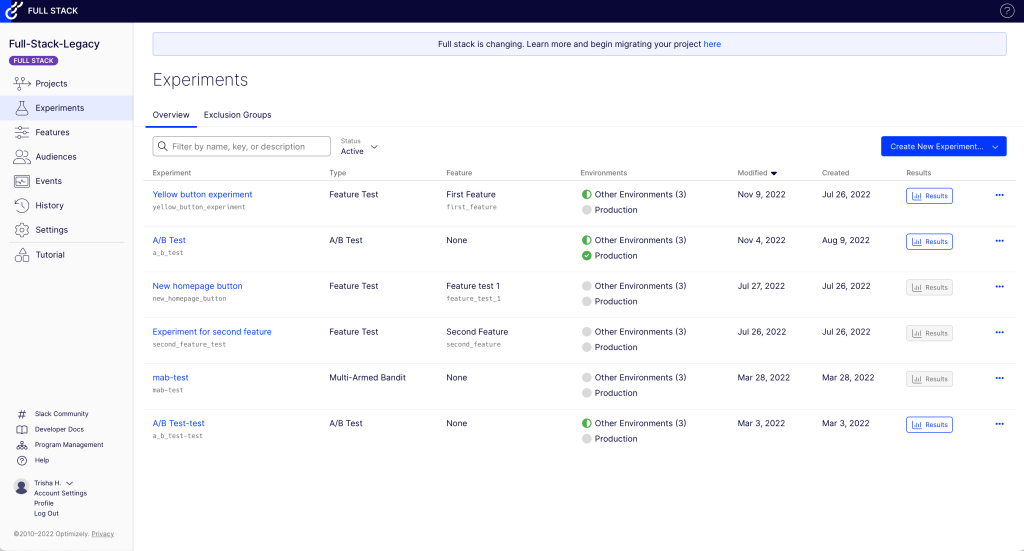
Optimizely is a popular testing tool for digital ad campaigns. It allows you to create and run A/B tests, compare different versions of ads and optimize your campaigns for maximum efficiency. With this platform, you can quickly identify which elements work best and adjust as needed.
Crazy Egg
Crazy Egg is an analytics platform that provides detailed insights into user behavior. It allows you to track clicks, mouse movements, and scrolling activity to understand what’s working for your ads. It also provides heat maps which can help you optimize ad placement for maximum visibility.

Unbounce
As your ads redirect users to landing pages, their optimization is also vital. Unbounce is perfect for the task. It lets you quickly create customized landing pages, test different elements, and track performance. It also offers built-in integrations with Google Ads, Facebook Ads, and other popular ad platforms to easily integrate your campaigns and optimize for maximum efficiency.

In Conclusion
The sphere of digital marketing always continues to evolve. The platforms introduce new rules and regulations, the habits of the audience change, and new social media appear. Hence, even if you have long experience with paid ads, analysis and optimization will remain essential to successful campaigns.
Though the process may seem tedious, it’s worth it. According to Techjury, digital ads can increase brand awareness by 80%. Our guide will help you build a strategy for testing and improving all your ads to boost your business.
Guest Author

Kate Parish is a chief marketing officer at Onilab. She has almost a decade of experience in the company and is still enthusiastic about every aspect of digital marketing. Kate sees the marketing mission as ensuring sustainable business growth. For this purpose, she helps companies and readers create efficient campaigns, solve common problems, and enhance crucial website metrics, such as conversions, bounce rates, and others.


